



Search News
Industry Portal
Popular Tags
How Energy Efficient Electric Traction Systems Cut Lifecycle Costs

Author
Time
Click Count
Why are energy efficient electric traction systems now a lifecycle cost issue, not just a technical upgrade?
Energy cost used to sit in one budget line. Today, it shapes the full asset case.
That shift matters because traction performance now affects electricity spend, maintenance intervals, fleet uptime, and refurbishment timing at the same time.
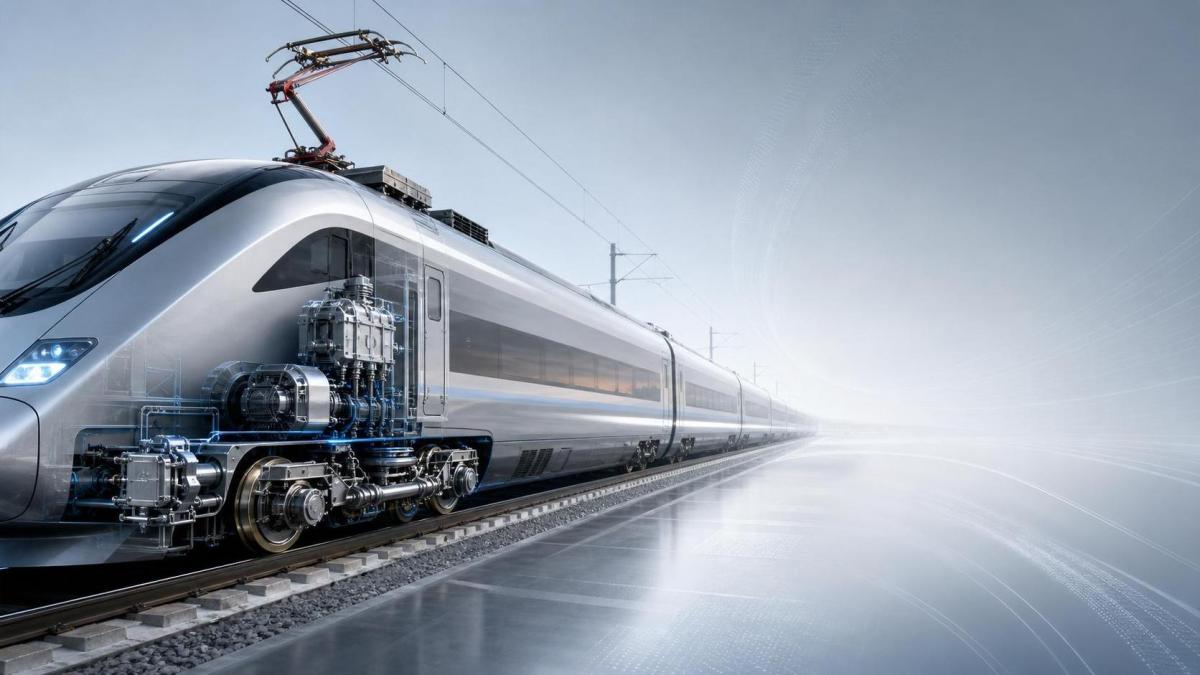
In practical terms, energy efficient electric traction systems reduce waste during acceleration, cruising, and braking. They also lower thermal stress on major components.
The result is rarely limited to a smaller power bill. The stronger benefit is a more predictable operating cost profile across the vehicle life.
This is why the conversation has moved beyond engineering preference. It now belongs in capex approval, asset planning, and tender evaluation.
For rail programs tied to dense service patterns, small efficiency gains can compound quickly. A few percentage points saved per trainset scale into material fleet-level savings.
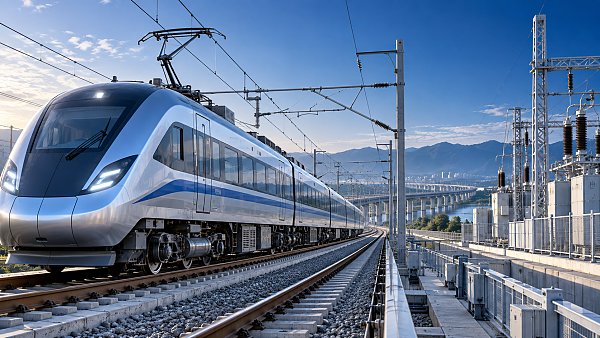
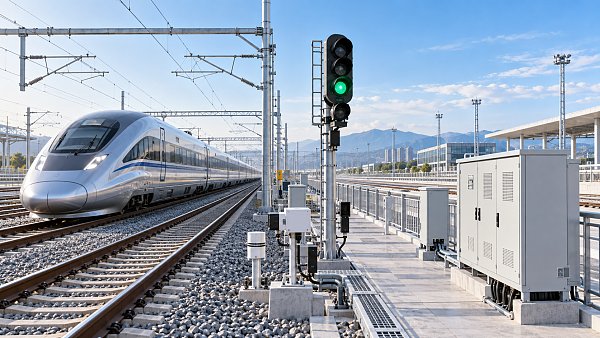
GTOT’s coverage of high-speed traction systems reflects this wider view. In modern transport, power efficiency is connected to reliability, safety margins, and commercial competitiveness.
That broader context also explains why energy efficient electric traction systems are increasingly discussed alongside pantographs, braking systems, and digital control architectures.
What actually makes a traction system “energy efficient” in financial terms?
The engineering definition matters, but the financial definition is stricter. Efficiency must survive operating reality.
A system deserves the label when it converts more input power into usable traction effort, manages heat effectively, and supports regenerative braking with minimal losses.
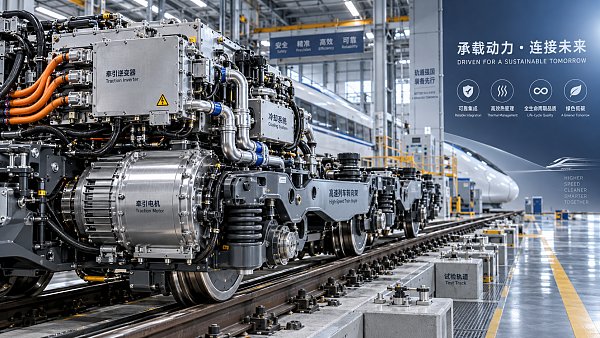
Key design elements usually include advanced traction converters, high-efficiency motors, intelligent control software, and stable current collection from the pantograph interface.
Software is often underestimated. Better control logic smooths torque delivery, avoids unnecessary peaks, and helps the vehicle stay inside its most efficient operating window.
Another factor is compatibility with the wider train architecture. If braking, signaling, and onboard diagnostics are poorly integrated, efficiency on paper may not appear in service.
More common evaluation points include the following:
- Traction energy consumption per kilometer under real duty cycles
- Regenerative braking recovery rate and grid usability
- Converter and motor thermal performance
- Maintenance hours per operating year
- Impact on wheel, brake, and auxiliary component wear
- Diagnostic visibility for early fault detection
In other words, energy efficient electric traction systems should be judged as operating assets, not isolated components.
Where do the lifecycle savings usually come from?
The first saving is obvious: lower electricity consumption. But that is usually only the visible layer.
A better traction package also reduces heat, vibration, and mechanical stress. That can extend service intervals and reduce unscheduled workshop events.
When regenerative braking works well, friction braking demand falls. Brake pad wear, dust, and maintenance effort can all improve.
Availability is another major cost lever. A train that spends less time out of service protects timetable stability and revenue capacity.
The table below helps frame where energy efficient electric traction systems usually change the cost model.
This is also why a lower purchase price can be misleading. A cheaper system may create a larger cost base over twenty or thirty years.
How should competing traction options be compared before approval?
A useful comparison starts with operating conditions, not vendor claims. Route profile changes the value equation.
Urban stop-start service rewards regenerative performance and thermal resilience. High-speed corridors place more emphasis on stable power conversion and aerodynamic interaction.
The better approach is to ask each bidder for performance under the same duty cycle assumptions, ambient conditions, passenger loads, and power tariffs.
Need to compare quickly? Focus on these questions:
- How much verified energy does the train consume per kilometer?
- How much braking energy is actually recovered and reused?
- What is the expected maintenance burden over the first overhaul cycle?
- Which components have the highest replacement cost exposure?
- What digital diagnostics are included as standard?
- How sensitive is performance to pantograph contact quality and grid variation?
In actual procurement, the strongest proposals usually show clear links between traction efficiency, signaling compatibility, braking coordination, and maintenance planning.
That integrated logic matters in the GTOT universe as well. High-value transport systems create returns when subsystems work together, not when each piece is optimized alone.
What mistakes make energy efficient electric traction systems look cheaper or better than they really are?
The most common mistake is treating laboratory efficiency as field efficiency. Duty cycle, weather, gradients, and network constraints can change the picture quickly.
Another error is valuing energy savings while ignoring integration cost. Software adaptation, depot tools, staff training, and spare strategy can shift payback materially.
Some evaluations also miss the infrastructure side. Regenerative braking has less value if the network cannot absorb or reuse returned energy effectively.
There is also a timing issue. Early savings may look attractive, while midlife replacement exposure remains hidden in the fine print.
A few caution points deserve attention:
- Do not compare systems using different route simulations
- Do not separate traction efficiency from pantograph and braking behavior
- Do not assume all recovered energy becomes monetizable savings
- Do not overlook warranty scope, software support, and obsolescence planning
- Do not treat maintenance access design as a secondary issue
These points matter because lifecycle cost errors usually come from assumptions, not arithmetic.
When does the payback become convincing enough to move forward?
There is no single threshold, but strong cases share a familiar pattern. Savings appear across multiple cost layers, not only energy.
Payback becomes more convincing when service intensity is high, electricity prices are volatile, and fleet availability has direct operational value.
It also strengthens when the supplier can show proven reliability in comparable rail environments, with transparent overhaul assumptions.
A disciplined approval case usually includes three views:
- Base case using current tariffs and maintenance assumptions
- Stress case with higher energy cost and tighter availability needs
- Sensitivity case for regeneration effectiveness and midlife parts pricing
That structure gives a more credible answer than a simple headline ROI figure.
Energy efficient electric traction systems are worth serious attention when they improve resilience as well as efficiency. In transport assets, those two qualities often pay together.
A sensible next step is to build a comparison model around route-specific energy use, overhaul timing, digital diagnostics, and availability impact.
From there, review technical evidence the same way you would review any long-life capital asset: by testing assumptions, not headlines.
That approach usually reveals whether a traction upgrade is merely efficient on paper, or truly lower in lifecycle cost.
Recommended News
 Sep 29, 2026What drives traction systems price differences between rail projects?Traction systems price differences explained: compare duty cycles, voltage compatibility, integration, localization, and lifecycle costs for smarter rail procurement.
 Sep 26, 2026What to assess before selecting an electric traction system manufacturerChoose an electric traction system manufacturer with confidence. Explore key criteria for performance, reliability, safety, integration, energy efficiency, and lifecycle support.
 Sep 25, 2026When do full digitalization systems justify the investment?Full digitalization systems: discover when rail and maritime operators can turn connected data into safer operations, higher availability, and measurable ROI.
 Sep 23, 2026What drives automatic train control systems cost on rail projects?Automatic train control systems cost depends on integration, migration, safety testing, communications, and lifecycle support. Explore the key budget drivers for rail projects.
 Sep 21, 2026How to assess an ocean going vessel builder’s delivery riskAssess an ocean going vessel builder’s delivery risk with proven checks for schedules, capacity, design maturity, critical equipment, quality, and project controls.
 Sep 20, 2026What drives rail safety technology costs over a project lifecycle?Rail safety technology cost goes beyond equipment—explore lifecycle drivers from integration and safety assurance to cybersecurity, commissioning, and obsolescence.
 Sep 16, 2026What to verify before choosing an advanced ocean-going vessels supplierAdvanced ocean-going vessels supplier checklist: verify design authority, build quality, digital systems, delivery reliability, and lifecycle support before you buy.
 Sep 15, 2026What rail safety technology best reduces level-crossing risks in Southeast Asia?Rail safety technology Southeast Asia: discover how fail-safe signalling, barriers, obstacle detection and remote monitoring reduce level-crossing risks.
 Sep 14, 2026How exporters can reduce customs delays in global trade logisticsGlobal trade logistics for exporters: reduce customs delays with accurate data, clearance-ready documents, early filing, and proactive exception management.
 Sep 13, 2026When do global transportation network systems reduce delivery delays?Global transportation network systems reduce delivery delays by improving rail-port-vessel coordination, real-time visibility, and proactive decisions across complex land-sea supply chains.
 Sep 09, 2026When should you choose a rail and maritime manufacturer with dual-sector capability?Rail and maritime manufacturer guide: learn when dual-sector capability reduces integration risk, improves lifecycle support, and strengthens rail-to-port operations.
 Sep 08, 2026What to verify before selecting a railway signalling equipment supplierRailway signalling equipment supplier checklist: verify safety evidence, integration, cybersecurity, delivery capability, and lifecycle support before award.
 Sep 07, 2026How to size a traction power transformer for railway load demandTraction power transformer sizing guide: model railway load demand, peak duty, voltage regulation, harmonics, and contingency capacity for reliable service.
 Sep 07, 2026How do customization options for industrial connectors affect lead times?Customization options for industrial connectors can impact lead times, cost, and compliance. Learn how to specify smarter for rail and marine projects.
 Sep 05, 2026What information should an industrial sourcing guide include?Industrial sourcing information procurement guide: evaluate suppliers, compliance, lifecycle costs, interfaces, and lead times for smarter rail and maritime purchasing decisions.
 Sep 01, 2026How to find reliable maritime tender information before biddingMaritime tender information: learn how to verify sources, define bid-ready scopes, check qualifications, and reduce risk before submitting competitive marine bids.
 Aug 30, 2026How to select railway automation equipment for depots with phased upgradesRailway automation equipment for depots: learn how to plan phased upgrades that improve safety, throughput, integration, and lifecycle control.
 Aug 27, 2026How industrial sourcing intelligence pricing data supports budget approvalIndustrial sourcing intelligence pricing data helps teams benchmark scope, assess supplier risk, and build defensible budget approvals for complex rail and maritime assets.
 Aug 26, 2026When does a marine fuel efficiency solution make financial sense in the Middle East?Marine fuel efficiency solution Middle East: learn when retrofit savings, compliance value, and vessel data align to deliver credible ROI and smarter shipping investment decisions.
 Aug 24, 2026When does maritime automation for tankers deliver a real payback?Maritime automation for tankers delivers real payback when it cuts fuel use, reduces cargo risk, and improves uptime. See how owners can time investment for stronger ROI.
 Aug 23, 2026When do maritime logistics systems in the Middle East justify the costMaritime logistics systems Middle East: discover when rising delays, manual coordination, and poor visibility make system investment the smarter move for regional operators.
 Aug 22, 2026What drives vessel navigation system price for commercial fleetsVessel navigation system price depends on integration, compliance, automation, and support—not just hardware. Learn what drives fleet costs and compare quotes with confidence.
 Aug 21, 2026How to assess shipbuilding maritime tenders before biddingShipbuilding maritime tenders require more than price checks. Learn how to assess technical scope, compliance, supply chain, and commercial risk before bidding with confidence.
 Aug 20, 2026When does working with an ocean-going vessels distributor reduce supply risk?Ocean-going vessels distributor: learn when this partner cuts supply risk through stronger compliance, faster response, and better sourcing resilience in complex maritime procurement.