



Search News
Industry Portal
Popular Tags
Interlocking Systems for Railway Safety: How to Compare Failure Risks
Author
Time
Click Count
For quality control and safety managers, evaluating interlocking systems for railway safety means more than checking compliance—it requires understanding how design logic, redundancy, diagnostics, and lifecycle conditions influence failure risk. This article explains how to compare risk factors across systems in a practical, evidence-based way, helping teams make safer decisions for high-density rail operations.
In modern rail networks, a single interlocking decision can affect route integrity, turnout position, signal clearance, and recovery time across dozens of train movements per hour. That is why comparing systems only by approved standards, vendor reputation, or acquisition cost often misses the real question: where can failure occur, how likely is it, and how effectively can the system detect and control the consequence?
For organizations managing metro, suburban, freight, or high-speed operations, the comparison process should connect technical architecture with operational exposure. A depot interlocking with 10 routes and low speed limits does not carry the same risk profile as a mainline node handling 24 trains per hour, multiple flank protections, and mixed traffic. The evaluation method must reflect that difference.
Why Failure Risk Comparison Matters in Interlocking Systems for Railway Safety
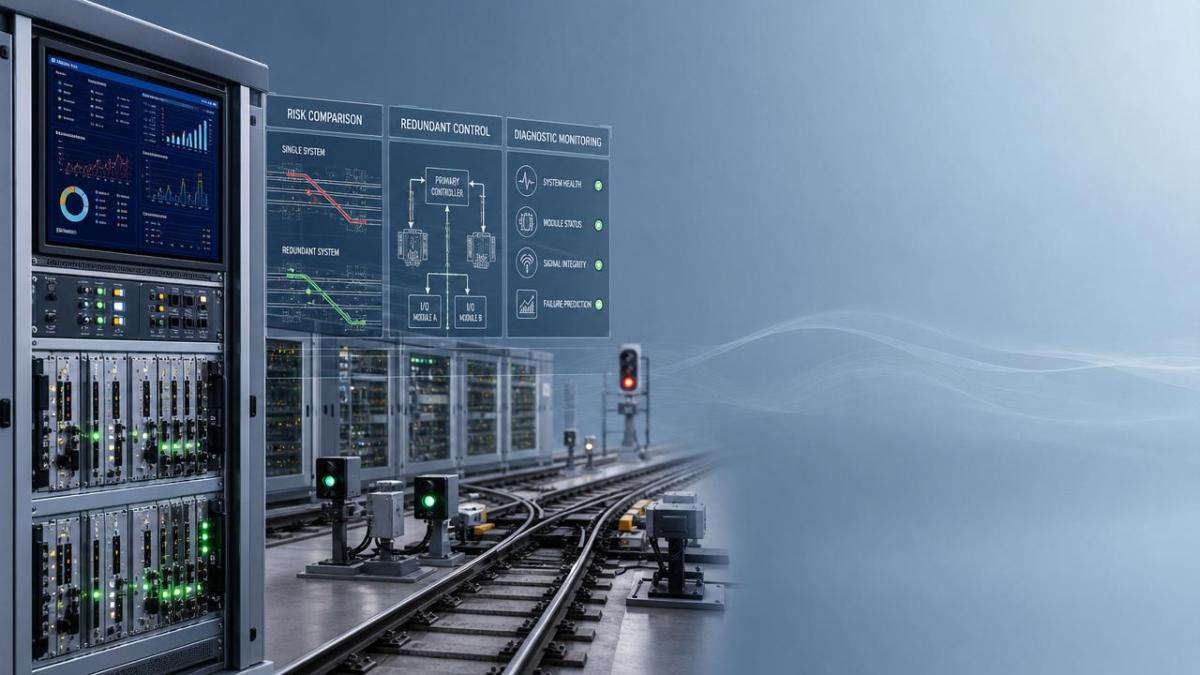
Interlocking systems for railway safety are designed to prevent incompatible movements, unsafe point settings, and signal aspects that could lead to collisions or derailments. However, not all failures carry the same operational meaning. Some faults force a safe shutdown within milliseconds. Others remain latent for weeks, only appearing when a rare route combination is called. Comparing those two categories is the first step to a realistic risk review.
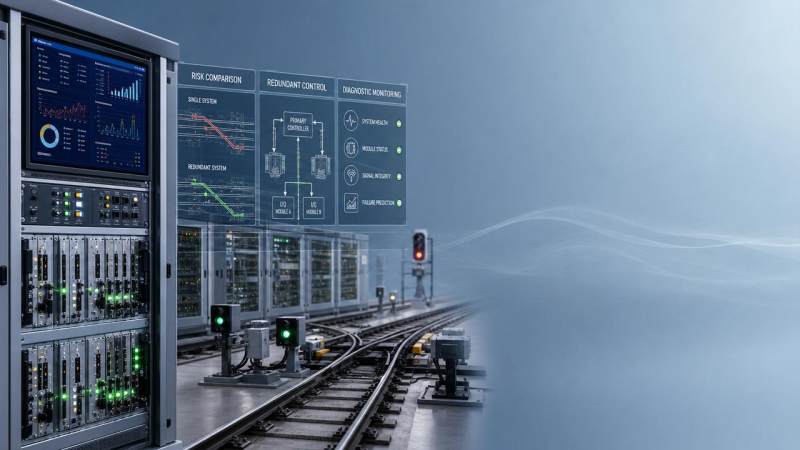
From a quality and safety perspective, failure risk should be reviewed through at least 4 lenses: failure frequency, detectability, consequence severity, and recovery effectiveness. In practice, these 4 dimensions are more useful than a simple pass/fail view because they reveal whether a system fails safely, fails visibly, or fails silently under degraded operating conditions.
The difference between compliance and comparative risk
A compliant system may satisfy required safety integrity targets such as SIL4 for vital functions, but comparison still matters when selecting between architectures, migration plans, or lifecycle support models. Two systems can both meet formal requirements while showing very different behavior in diagnostics coverage, mean time to repair, software change control, or susceptibility to interface faults.
For example, one interlocking may isolate a failed input card within 1 second and preserve local routing flexibility. Another may trigger a broad shutdown zone covering 6 to 10 track sections. Both may remain safe, but the second option creates greater service disruption, more manual intervention, and increased human-factor exposure during recovery.
Typical failure paths that should be compared
- Unsafe command prevention failure in route locking or conflict checking logic
- Point detection mismatch caused by sensor, wiring, or drive machine issues
- Signal aspect control faults at the interlocking-to-field interface
- Data communication loss between interlocking, object controllers, and supervisory layers
- Latent software logic errors triggered by rare route combinations or maintenance states
- Power supply degradation, battery backup exhaustion, or grounding-related disturbances
These paths should be ranked not only by hazard severity but also by exposure time. A fault occurring once every 5 years in a low-utilization siding may be less critical than a nuisance-safe failure occurring twice per month at a junction that handles 18 to 30 train paths per peak hour. For safety managers, service impact and emergency handling burden are part of the broader risk picture.
A practical comparison frame for safety teams
The table below provides a useful framework for comparing interlocking systems for railway safety during tender review, modernization planning, or periodic technical audit. It focuses on the factors that most directly influence failure risk in real operations.
The key lesson is that risk comparison should extend beyond core logic boards. In many projects, the highest operational vulnerability sits at interfaces, maintenance processes, and degraded-mode handling rather than in the central processor itself. This is especially important for dense urban rail and mixed-traffic corridors.
How to Compare Failure Risks Across Design, Operation, and Lifecycle Stages
A sound comparison method should move through 3 stages: design review, operational validation, and lifecycle resilience assessment. This structure helps quality teams avoid the common mistake of selecting a system that performs well in factory documentation but poorly under real maintenance pressure, interface complexity, or aging field conditions.
Stage 1: Review design logic and fail-safe principles
Start with route logic, flank protection, point locking, release conditions, overlap control, and degraded-mode rules. At this stage, ask whether the interlocking defaults to the safest state within the required response window, typically in milliseconds to a few seconds depending on the function and architecture.
Also examine common-cause failure protection. A dual-channel design is not automatically low risk if both channels share one software baseline, one cabinet environment, or one power conditioning path. Separation of hardware, software diversity where relevant, and independent verification depth are all meaningful indicators.
Questions safety teams should ask
- What are the defined safe states for signals, points, and route commands?
- How quickly are dangerous discrepancies detected and inhibited?
- Which functions rely on internal voting, and how is disagreement handled?
- What assumptions were made in hazard analysis about external equipment behavior?
- How are temporary engineering changes controlled during commissioning and expansion?
Stage 2: Compare diagnostics, maintenance burden, and recovery performance
A system with excellent vital logic can still create high operational risk if diagnostics are weak. When alarms only indicate a general area instead of a precise failed module, isolation time expands, temporary operating rules multiply, and manual confirmation steps increase. In busy networks, every extra 10 to 15 minutes of uncertainty can widen the risk envelope.
Look for evidence on mean time to detect, mean time to isolate, and mean time to restore. Even if suppliers use different terminology, you can normalize the comparison by checking 3 practical outputs: how many maintenance steps are required, what tools are needed on site, and whether one trained technician can localize the fault without broad service suspension.
The following table helps translate maintenance and diagnostics features into comparative risk signals that quality control and safety managers can use during evaluation.
This comparison shows why lower failure frequency alone does not guarantee lower risk. If a fault is hard to locate, difficult to restore, or dependent on specialist attendance within 24 to 48 hours, the operational and human-factor burden rises sharply during disruption.
Stage 3: Evaluate lifecycle risk under real network conditions
Interlocking systems for railway safety should be assessed over a lifecycle that often spans 15 to 30 years. During that time, traffic density may increase, control centers may be centralized, field devices may be renewed in phases, and cybersecurity requirements may tighten. A system that appears robust at commissioning can become harder to defend if its support model, parts strategy, or modification process is weak.
Safety managers should therefore compare not only present-day architecture but also future adaptability. Key questions include whether the platform supports staged migration, whether test environments are available for offline validation, and whether configuration changes can be audited down to object, route, and version level. These controls reduce the risk of introducing hidden defects during expansion.
High-Value Risk Indicators for Procurement and Audit Decisions
During procurement or periodic review, teams often receive large volumes of technical documentation but limited practical comparability. To improve decision quality, focus on a compact set of indicators that directly influence failure exposure, consequence control, and maintainability. A shortlist of 6 to 8 indicators usually gives a better decision base than a generic checklist of 50 items.
Priority indicators to score
- Fail-safe response behavior under power loss, data corruption, and I/O disagreement
- Diagnostic depth, log quality, and post-event traceability
- Resistance to common-cause failure across channels and cabinets
- Maintainability during night possessions, remote sites, and limited staffing windows
- Configuration control during software patches, route additions, and field replacements
- Support for phased migration from relay or older electronic interlocking environments
- Training burden for operators, maintainers, and incident investigators
A practical scoring scale is 1 to 5 for each indicator, combined with severity weighting. For example, fail-safe response and common-cause resistance may carry a weight of 25% each, while training burden may carry 10%. This produces a structured comparison without pretending that every criterion has equal safety significance.
Common mistakes in comparing interlocking systems
Mistake 1: Treating all safe failures as low concern
A safe failure that repeatedly closes routes across a critical throat can still create elevated operational risk by pushing staff into manual fallback procedures. If this occurs 2 or 3 times per month, fatigue, rule deviations, and dispatching complexity become part of the safety picture.
Mistake 2: Ignoring interface quality
Many incidents originate at the boundary between the interlocking and power supply units, point machines, train detection, communications networks, or supervisory systems. Interface fault handling should be reviewed with the same rigor as central logic design.
Mistake 3: Underestimating obsolescence risk
If spare modules, supported operating environments, or qualified maintenance tools become scarce after 5 to 7 years, the practical risk can grow even when the original safety case remains valid. Long-term support planning is therefore a safety topic, not only a commercial one.
Implementation Guidance for Quality Control and Safety Managers
To turn comparison into action, build a repeatable review process that combines engineering evidence with field feedback. This is particularly valuable for operators managing network expansion, digitalization, or multi-vendor environments where technical assumptions can drift over time.
A 5-step evaluation workflow
- Define the operating scenario: traffic density, route complexity, speed profile, and degraded-mode exposure.
- Map credible failure modes across logic, field interface, communication, power, and maintenance actions.
- Score each mode by detectability, severity, exposure frequency, and restoration burden.
- Validate assumptions using test records, fault logs, maintenance reports, and commissioning evidence.
- Set mitigation actions with review cycles of 6 or 12 months depending on asset criticality.
This 5-step structure works well for tender review, acceptance planning, periodic audit, and upgrade programs. It also creates a shared language between safety teams, signalling engineers, procurement managers, and maintenance leadership, reducing the chance that important risk indicators are lost between departments.
What evidence should be requested from suppliers or internal teams
Ask for hazard logs, verification reports, diagnostics descriptions, software change procedures, failure response sequences, and maintainability instructions. If the asset is already in use, request at least 12 months of fault trend data categorized by subsystem. Even where exact statistics differ by network, trend consistency is highly valuable for comparison.
For organizations following the broader intelligence-driven transport perspective promoted by GTOT, the strongest decisions come from connecting component-level evidence with system-level resilience. In rail signalling, that means understanding how interlocking, braking response, traction power continuity, and operational command discipline work together under stress, not as isolated technical silos.
When to trigger a deeper reassessment
- Repeated safe shutdowns in the same control area within a 30 to 90 day window
- Software updates affecting route logic, object control, or communication drivers
- Traffic growth above the original operating envelope, such as a 20% increase in throughput
- Migration to centralized traffic control or new onboard and wayside interfaces
- Aging assets approaching parts obsolescence or support contract transition points
Interlocking systems for railway safety should never be treated as static assets after commissioning. Their risk profile changes with network load, maintenance quality, supplier support, and integration complexity. Continuous review is therefore a practical control, not an administrative formality.
For quality control and safety managers, the most effective comparison method is one that links fail-safe design, diagnostic transparency, recovery performance, and lifecycle support into a single decision framework. When these factors are reviewed together, it becomes easier to distinguish between systems that are merely compliant and systems that are genuinely resilient in dense, real-world rail operations.
GTOT supports this type of evidence-based evaluation by focusing on the technical and commercial intelligence behind railway control components and broader transport systems. If you are reviewing interlocking systems for railway safety, planning modernization, or refining your supplier assessment criteria, contact us to get a tailored comparison framework, discuss product details, or explore more rail safety solutions.
Recommended News
 Aug 29, 2026What to verify before choosing a railway interlocking equipment exporterRailway interlocking equipment exporter checklist: verify safety evidence, interfaces, engineering, traceability, export readiness, and long-term support before procurement.
 Aug 15, 2026How to choose railway interlocking equipment for junctionsRailway interlocking equipment for junctions: learn how to choose the right system for safety, capacity, and future expansion with confidence.
 Jul 14, 2026Rail Interlocking Systems: Common Failure Risks and Design ChecksRail interlocking systems face critical risks from route locking, point detection, track vacancy, and interface timing. Learn the key design checks that improve safety and reduce commissioning risk.
 Jul 06, 2026When to Choose a SIL4 Signalling Equipment Integrator Over Multiple VendorsSIL4 signalling equipment integrator or multiple vendors? Learn when unified integration reduces interface risk, speeds safety approval, and protects rail project delivery.
 Jul 01, 2026Electronic Railway Interlocking Systems: Key Failure Risks and Compliance ChecksRailway interlocking systems electronic risks can disrupt safety, uptime, and compliance. Explore key failure points, practical checks, and proven ways to strengthen rail resilience.
 Jun 23, 2026Interlocking Systems: Key Failure Risks and Safety Checks Before DeploymentInterlocking systems: discover key failure risks, interface hazards, and must-do safety checks before deployment to prevent costly incidents and ensure fail-safe performance.
 Jun 19, 2026Interlocking Systems for Railway Safety: Key Standards and Failure RisksInterlocking systems for railway safety: explore key standards, SIL4 expectations, and hidden failure risks to strengthen railway compliance, resilience, and safe operations.
 Jun 10, 2026How Interlocking Systems Reduce Rail Network Failure RiskInterlocking systems reduce rail network failure risk by preventing conflicts, containing faults, and speeding recovery. See how they improve safety, uptime, and operational resilience.
 Jun 05, 2026Railway Control Components: Key Failure Points to AvoidRailway control components fail in different ways across urban, high-speed, freight, and harsh outdoor routes. Discover the key failure points to avoid for safer, more reliable rail operations.
 Jun 03, 2026Railway Signal Control Systems: Common Failure Points and Safety ChecksRailway signal control systems require rigorous safety checks. Discover common failure points, inspection priorities, and practical steps to reduce risk and protect rail operations.
 Jun 02, 2026How to Evaluate Railway Control Components for System ReliabilityRailway control components evaluation guide: assess SIL compliance, interoperability, stress testing, cybersecurity, and lifecycle reliability for safer rail systems.
 May 31, 2026Interlocking Systems Technology Standards: Key Compliance RisksInterlocking systems technology standards expose critical compliance risks in SIL validation, cybersecurity, and traceability—learn how to protect rail safety and approvals.
 May 28, 2026Interlocking Systems for High-Density Rail Operations: What Improves Capacity Safely?Interlocking systems for high-density rail operations: discover how SIL4-safe architectures, redundancy, and automation interfaces boost rail capacity, resilience, and future readiness.
 May 26, 2026Interlocking Systems for Railway Safety: How to Compare Failure RisksInterlocking systems for railway safety: compare failure risks through design logic, diagnostics, redundancy, and lifecycle factors to make safer, smarter rail decisions.
 May 21, 2026Interlocking Systems Technology Standards: Key Compliance Checks for 2026Interlocking systems technology standards guide 2026 rail compliance checks on safety traceability, software control, cybersecurity, and field integrity. Learn key risks and practical actions.
 May 20, 2026Interlocking Systems for High-Density Rail: Capacity Gains vs Safety TradeoffsInterlocking systems for high-density rail operations: explore how modern architectures boost rail capacity, reduce headways, and manage safety tradeoffs for smarter network planning.
 May 19, 2026Interlocking Systems for Railway Safety: Choosing for Retrofit ProjectsInterlocking systems for railway safety: learn how to choose the best retrofit path with SIL4 assurance, legacy compatibility, lower risk, and future-ready performance.
 May 17, 2026How Computer Interlocking Cuts Rail Signaling Failure RiskInterlocking systems cut rail signaling failure risk by preventing route conflicts, reducing human error, and supporting SIL4 safety—see how computer interlocking boosts reliable, high-density operations.