



Search News
Industry Portal
Popular Tags
Urban Rail Pantograph Price: What Drives Lifecycle Cost
Author
Time
Click Count
Urban Rail Pantograph Price: What Drives Lifecycle Cost
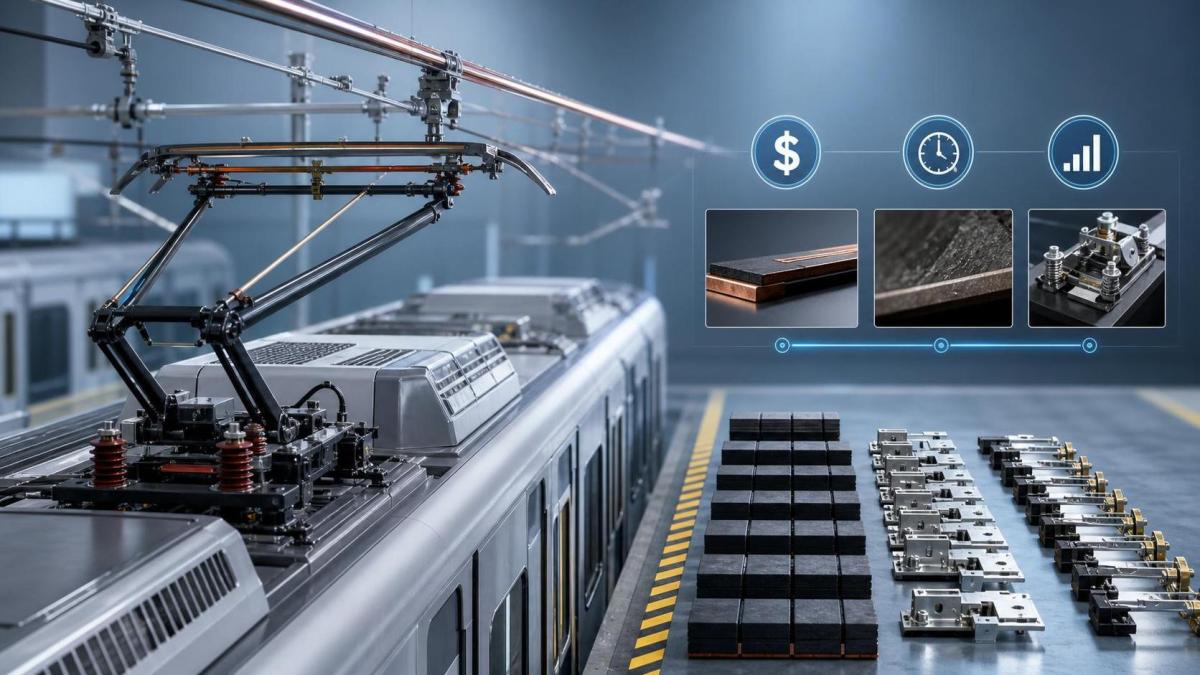
For most buying teams, urban rail pantograph price looks simple at first glance.
A unit rate appears in the quote, then comparison starts.
But in actual rail operations, purchase price is only the visible layer.
The bigger cost often comes later, through wear, downtime, inspections, and unstable current collection.
That is why urban rail pantograph price should always be reviewed as a lifecycle question.
In metro, suburban, and light rail networks, service density is high and maintenance windows are short.
A lower upfront offer can quickly become expensive if replacement parts wear faster than expected.
The same applies when a pantograph causes contact wire damage or frequent workshop visits.
From a cost-control perspective, the best decision balances technical fit, service life, and supply assurance.
Why Urban Rail Pantograph Price Is Not the Real Benchmark
A metro operator does not buy a pantograph once.
It buys years of energy collection performance.
This is the main reason urban rail pantograph price can mislead early evaluations.
A cheaper product may carry higher inspection frequency, shorter carbon strip life, or limited spare part availability.
Once those factors are added, the total cost picture changes fast.
More importantly, pantograph performance affects the wider traction system.
Poor contact stability can raise arc incidents, increase overhead line wear, and reduce fleet availability.
That also means urban rail pantograph price should be measured against system-level consequences, not just component cost.
Core lifecycle cost elements
- Contact strip replacement frequency
- Preventive maintenance labor hours
- Corrective maintenance after failures
- Damage risk to catenary and related assets
- Vehicle downtime and service disruption cost
- Spare parts lead time and stock burden
- Retrofit or interface adaptation expenses
What Usually Drives Total Ownership Cost
Several cost drivers shape the real outcome behind urban rail pantograph price.
Some are obvious during tender review.
Others only become visible after months of operation.
1. Contact strip wear rate
This is often the first hard cost line after purchase.
Strip material, operating speed, current demand, and line condition all influence replacement cycles.
If strip life is short, urban rail pantograph price loses relevance very quickly.
2. Maintenance interval and labor intensity
Urban networks run frequent services and tight depot schedules.
A design requiring frequent adjustment, calibration, or inspection creates recurring cost pressure.
In practice, labor-heavy equipment can outweigh any advantage in urban rail pantograph price.
3. Current collection stability
Stable contact is not just a technical preference.
It directly affects energy transfer, arc behavior, and wire wear.
A well-controlled head response under vibration usually lowers network-wide maintenance cost.
4. Compatibility with rolling stock and overhead line
Not every pantograph fits every train or line configuration equally well.
Mounting space, operating height, uplift force range, and control interface matter.
A low urban rail pantograph price can hide expensive integration work later.
5. Reliability in dense duty cycles
Urban services mean constant acceleration, braking, station stops, and repeated daily cycles.
A pantograph that performs well in test conditions may behave differently in heavy commuter operation.
This is where field references become more useful than brochure claims.
How to Compare Suppliers Beyond Unit Price
A strong comparison model turns urban rail pantograph price into a measurable commercial decision.
The best approach is to compare expected operating cost over the asset period.
That evaluation should combine technical, service, and supply-chain variables.
This kind of matrix brings discipline to urban rail pantograph price benchmarking.
It also helps internal stakeholders align around a common cost model.
Common Mistakes in Pantograph Cost Evaluation
From recent procurement cycles, a few mistakes appear again and again.
Most of them come from using incomplete cost assumptions.
- Choosing the lowest urban rail pantograph price without checking strip consumption data.
- Treating all suppliers as technically equal when head dynamics differ greatly.
- Ignoring mounting and control interface adaptation costs.
- Underestimating the cost of delayed spare parts.
- Relying only on laboratory results instead of in-service references.
- Skipping long-term maintenance input from depot teams.
These errors usually show up after contract award, when fixing them becomes expensive.
A more careful review upfront reduces both cost leakage and operational risk.
A Practical Buying Framework for Better Decisions
A useful procurement framework keeps urban rail pantograph price in the right context.
It starts with operating reality, not with the first quote sheet.
Step 1: Define the real duty profile
Map speed range, daily mileage, current demand, stop frequency, and line environment.
Without this baseline, urban rail pantograph price comparisons stay too generic.
Step 2: Request lifecycle data
Ask for strip life, overhaul intervals, failure history, and recommended spare parts coverage.
Comparable fleet references matter more than polished marketing language.
Step 3: Quantify hidden cost lines
Add labor, downtime, wire wear risk, training, tooling, and retrofit expenses.
This usually gives a more honest view than urban rail pantograph price alone.
Step 4: Stress-test service support
Check response time, local stock strategy, engineering support, and documentation quality.
A reliable support model often protects cost better than a lower initial quotation.
Step 5: Score commercial resilience
Review supply continuity, certification readiness, and long-term product roadmap.
That becomes especially important in multi-year fleet programs.
Final Takeaway on Urban Rail Pantograph Price
The most effective cost decision rarely comes from the lowest visible offer.
It comes from understanding how urban rail pantograph price interacts with maintenance, reliability, and system compatibility.
When those variables are measured early, cost risk becomes easier to control.
A disciplined lifecycle review also improves supplier negotiations and internal approval confidence.
In practical terms, the right question is not simply the urban rail pantograph price.
The better question is what that price will cost over years of dense, real-world operation.
That shift in thinking usually leads to better contracts, steadier performance, and lower ownership cost overall.
Recommended News
 Jul 30, 2026How to Specify Traction Power Equipment Switchgear for Urban Rail ProjectsTraction power equipment switchgear selection for urban rail starts with system duty, fault levels, maintainability, and lifecycle cost. Learn how to specify the right solution with confidence.
 Jul 15, 2026How to Evaluate an Urban Rail Pantograph Manufacturer for Long-Term ReliabilityUrban rail pantograph manufacturer selection affects safety, uptime, and lifecycle cost. Learn how to assess engineering, testing, production control, and support for long-term reliability.
 Jul 09, 2026Urban Rail Pantograph Price: What Drives Lifecycle CostUrban rail pantograph price is only the starting point. Discover what really drives lifecycle cost, from wear and downtime to reliability, maintenance, and supplier support.
 Jul 04, 2026How to Evaluate Railway Pantograph Components for EMU ReliabilityRailway pantograph components for EMU reliability: learn how to assess contact stability, wear, dynamics, and lifecycle risk to improve fleet performance and reduce maintenance costs.
 Jul 01, 2026How to Evaluate Pantographs for Tram Systems by Wear, Noise, and UptimePantographs for tram systems: learn how to evaluate wear, noise, and uptime with practical metrics that reduce risk, improve reliability, and support smarter fleet decisions.
 Jun 27, 2026Pantograph Components Checklist for Retrofit and ReplacementPantograph components checklist for retrofit and replacement: learn how to assess compatibility, wear, climate, and lifecycle cost to improve rail reliability and reduce downtime.
 Jun 26, 2026Urban Rail Pantographs: Selection Factors for Stable Current CollectionUrban rail pantographs are key to stable current collection. Learn the selection factors that improve reliability, reduce wear, and support efficient metro and light rail operations.
 Jun 26, 2026Urban Rail Pantographs: Common Wear Problems and FixesUrban rail pantographs face wear from arcing, contamination, and mechanical looseness. Learn the common problems, practical fixes, and maintenance tips to boost reliability and cut downtime.
 Jun 17, 2026How to Compare Pantographs Manufacturers for Urban Rail ProjectsPantographs manufacturers for urban rail: learn how to compare technical performance, lifecycle cost, certifications, and service support to choose lower-risk suppliers for transit projects.
 Jun 11, 2026How to Compare Pantographs Manufacturers for Urban Rail ProjectsPantographs manufacturers for urban rail should be compared on technical fit, lifecycle cost, quality control, and support. Learn how to choose a reliable supplier with confidence.
 Jun 06, 2026Pantographs Manufacturers for Urban Rail: Key Checks Before ShortlistingPantographs manufacturers for urban rail: discover the key checks for technical fit, compliance, reliability, and after-sales support before shortlisting suppliers.
 May 27, 2026How to Compare Urban Rail Pantographs Manufacturers in 2026Pantographs manufacturers for urban rail: learn how to compare suppliers in 2026 by performance, compliance, lifecycle cost, and support to reduce risk and choose with confidence.
 May 19, 2026Pantographs Manufacturers for Urban Rail: What Impacts Lifecycle Value?Pantographs manufacturers for urban rail: discover what drives lifecycle value beyond price, from contact stability and maintenance to compatibility, testing, and long-term fleet reliability.
 May 07, 2026Traction Power Issues Behind Repeated Rail System DowntimeTraction power issues often hide behind repeated rail downtime. Learn the key fault triggers, fast-check methods, and maintenance insights to restore reliability and cut recurring failures.